Richest Counties in South Dakota (2026)
by Kristen Carney
Updated: February 9, 2026
Richest County in South Dakota
The richest county in South Dakota is Lincoln County with an average household income of $132,275 as of 2024 and 70,638 people as of 2024 according to the most current Census data available (citation).
| Rank | County | Population | Average Income | Median Income |
|---|---|---|---|---|
| 1 | Lincoln County | 70,638 | $132,275 | $99,166 |
| 2 | Union County | 17,081 | $124,814 | $89,636 |
| 3 | Miner County | 2,300 | $112,618 | $76,140 |
| 4 | Custer County | 8,892 | $110,413 | $84,112 |
| 5 | Hamlin County | 6,373 | $109,883 | $87,101 |
| 6 | Edmunds County | 4,048 | $109,413 | $81,630 |
| 7 | Douglas County | 2,828 | $107,200 | $86,442 |
| 8 | McPherson County | 2,145 | $106,329 | $66,906 |
| 9 | Perkins County | 3,001 | $105,323 | $66,908 |
| 10 | Sully County | 1,526 | $105,002 | $72,578 |
| 11 | Lake County | 10,972 | $104,754 | $76,808 |
| 12 | Harding County | 1,148 | $104,230 | $80,441 |
| 13 | Hanson County | 3,472 | $104,104 | $81,071 |
| 14 | Marshall County | 4,344 | $103,822 | $78,156 |
| 15 | Minnehaha County | 203,289 | $102,921 | $76,880 |
| 16 | Hand County | 3,140 | $101,745 | $74,635 |
| 17 | McCook County | 5,751 | $101,460 | $83,852 |
| 18 | Campbell County | 1,593 | $101,350 | $68,929 |
| 19 | Jerauld County | 1,772 | $100,206 | $73,750 |
| 20 | Lyman County | 3,724 | $99,810 | $67,143 |
Median Income versus Average Income: Which Should You Use?
We usually suggest using median income data – either instead of or in addition to – average income data as a true indicator of wealth. If you haven’t thought about median versus average since your last standardized test, you aren’t alone. Here’s what they are:
- average is the sum of a set of numbers divided by the count of numbers in the set
- median is the middle number in the set of numbers
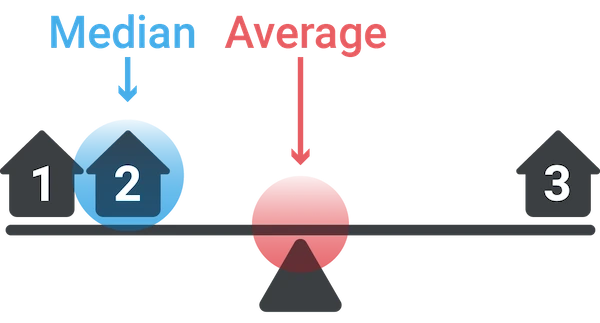
Now let’s say you had the following simplified set of income data.
Household 1: $30,000
Household 2: $50,000
Household 3: $1,000,000
The average income for this set is $360,000. The outlier data point ($1,000,000) skews the average WAY up. Conversely, the average income would be skewed WAY down if someone had an income of $500. The median income for the same data set is $50,000. Outlier data doesn’t skew the median.
Most Business Owners Should Use Median Income
So most business owners should use the median income as a true indicator of wealth, because it provides a more accurate representation of a typical income, especially in areas with significant income disparity.
When Should You Use Average Income
If your target market is high-income households, the average income may be more relevant. This is because the average income can highlight the presence of a higher concentration of wealthy individuals, which is beneficial for luxury goods and services marketing. We’re using average income on this page because using the Census’s highest reported median value of $250,001 could result in multiple ties for the richest geography.
Why do so many cities have a median value of $250,001?
The Census' American Community Survey uses $250,000+ as a jam value for median income estimates to protect privacy, ensure data consistency, and simplify reporting. A "jam value" in survey data refers to a placeholder or default value used when actual data points are unavailable, incomplete, or exceed certain thresholds. We represent this jam value as $250,001 to make it easy for you to sort.
You might also be interested in:
Email Me When New Data Are Released
Join thousands of subscribers and receive just 1 (ONE!) email a year in December when the US Census Bureau releases new income data for South Dakota richest counties.
SOURCES
United States Census Bureau. Annual Estimates of the Resident Population: April 1, 2020 to July 1, 2024. U.S. Census Bureau, Population Division. Web. May 2025. http://www.census.gov/.
United States Census Bureau. B01001 SEX BY AGE, 2024 American Community Survey 5-Year Estimates. U.S. Census Bureau, American Community Survey Office. Web. 29 January 2026. http://www.census.gov/.
United States Census Bureau. B19013 Median Household Income, 2024 American Community Survey 5-Year Estimates. U.S. Census Bureau, American Community Survey Office. Web. 29 January 2026. http://www.census.gov/.
United States Census Bureau. “DP03 SELECTED ECONOMIC CHARACTERISTICS.” 2024 American Community Survey 5-Year Estimates. U.S. Census Bureau, American Community Survey Office. Web. 29 January 2026. http://www.census.gov/.
Products & Services
Plumbing
Connect
- 1-800-939-2130
- Contact Us
© Copyright 2026 Cubit Planning, Inc.